Example of a two-variable inequality
But before I could make the graph, I decided to write an inequality to represent the situation. While it would have been possible to create the graph without the inequality, I wouldn't have an easy way of checking which combinations of games and tickets are allowed without the inequality. This would have made me less organized and much more likely to make a silly mistake.
So when I sat down to write the inequality, I knew that no matter what, I couldn't spend more than $3,000. But I also didn't have to spend it all; I could save some of it. Therefore, the money I spend had to be less than or equal to $3,000. What I still needed was a mathematical expression for how much money I was going to spend. Because each video game was $60, 60v would be how much I spent on v number of video games. If I bought two, I would just do 60(2) = $120, and that would be how much I spent on video games. Using the same logic, 300p is how much I spent on p plane tickets, so then 60v + 300p would represent the total amount of money I spent.
So we have our inequality that allows us to quickly plug in combinations of games and tickets to see if I can afford it. But we still want the graph in order to see what my different options are in one nice picture.
Graphing Two-Variable Inequalities
To get my graph, I knew I needed two points. So I thought to myself, 'if I decide to be a terrible boyfriend and not buy a single plane ticket, but instead spend every penny I have on video games, how many could I get?' Substituting these values into our equation and quickly solving for v using inverse operations tells us that I would be able to purchase 50 video games! At this point we can go ahead and put a point on our graph where v= 50 and p = 0.
But we need two points to find a line, so I also needed to ask myself the question, 'If I put love first and simply fly out to Minnesota as many times as possible, how many times could I go?' Substituting in these slightly different values and instead solving for p tells us that I would be able to fly out to Minnesota ten times. This gives us another point on our graph, one at v = 0 and p = 10.
Now, simply connecting these two points gives us the line 60v + 300p = 3,000. That means that all the points on this line are possible combinations of video games and plane tickets for me to choose. But we need to be careful, because this is where 60v + 300p equals 3,000, which means that all the points on this line - our combinations of video games and plane tickets - have me spending all my money.
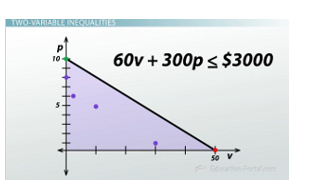
The shaded area on the graph represents solutions to the inequality
It's probably a good idea to save some of it, right? So maybe instead of getting ten plane tickets I only get eight. Or maybe I'd get one video game and six plane tickets. Or maybe I'd only get five planet tickets but get ten video games, or maybe I'd get only one plane ticket but 30 video games. As it turns out, any point underneath our line is a possible solution, so we shade the entire area underneath the line to indicate that any point within this space is an acceptable choice for me to make. What we have now is the graph of the inequality 60v + 300p is less than or equal to 3,000 that helped me decide how to spend my summer school paycheck! If you're curious, I decided to go with three plane tickets and two video games.
This was an example of a two-variable inequality. All two-variable inequality graphs will look something like this: a line, and shading on one side of that line. But there are also one-variable inequalities as well. To see what is different about a one-variable inequality, and to learn more about the nuts and bolts behind solving and graphing inequalities, check out the other inequality lessons.
Lesson Summary
Inequalities are equations with greater-than or less-than symbols instead of equal signs. Instead of just having one answer, like equations do, there can be multiple answers to an inequality. This is because instead of having to be equal, they can simply be anything that is less or greater than. Finally, graphs of two-variable inequalities have a line and half of the graph shaded, where the shaded part depends on whether it was less-than or greater-than.